
Hierarchy Chart
登录后可下载

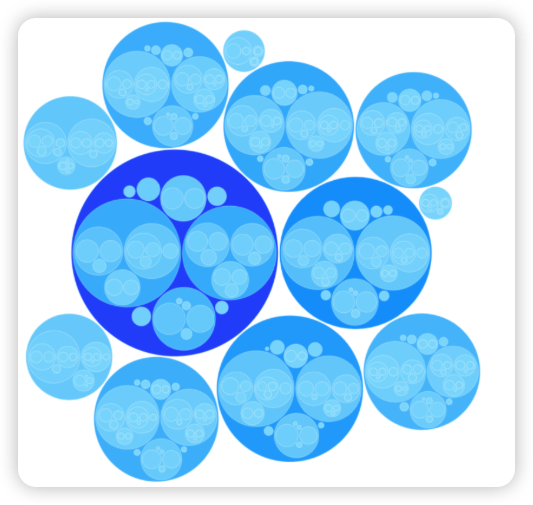
The Hierarchy Chart is a hierarchical structure of data visualized on the Chart in the form of balls and nested one inside another based on the hierarchy structure.
层次结构图是数据的层次结构,以球的形式在图表上可视化,并根据层次结构将一个嵌套在另一个内部。
The Chart allows you to visualize data with a large number of hierarchies that cannot be displayed on other charts, for example, "sun rays".
Chart 允许您可视化具有大量层次结构的数据 ,这些层次结构无法显示在其他图表上,例如“sun rays”。
The Hierarchy Chart provides visualization of complex hierarchies and simplifies the perception of multi-level data, and is also universal for use.
层次结构图提供了复杂层次结构的可视化,简化了对多级数据的感知, 并且还具有通用性。
The Chart is interactive with the ability to move from ball to ball.
图表 是交互式的,能够从一个球移动到另一个球。
The example below shows the income structure of bank branches.
以下示例显示了银行分行的收入结构。
For answers to your questions and consultations, please contact us in telegram: @codexproj or e-mail: info@codexproj.ru.
如需解答您的问题和咨询,请通过 Telegram: @codexproj 或电子邮件: info@codexproj.ru 与我们联系。