甘特图
登录后可下载

https://help.fanruan.com/finebi6.X/doc-view-2703.html
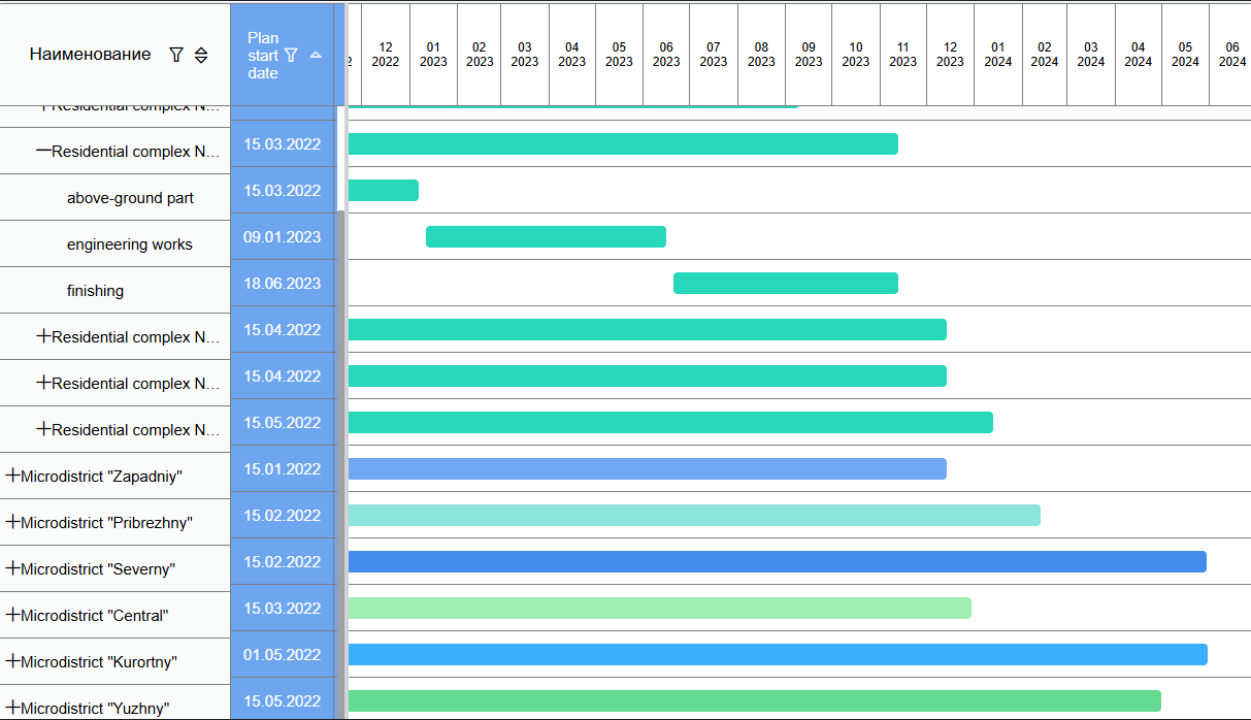
The Gantt Chart is a horizontal histogram for visualizing the work schedule, performing other activities, showing tasks, their duration and sequence within projects and plans.
甘特图是一个水平直方图,用于可视化工作计划、执行其他活动、显示任务、任务的持续时间和项目和计划中的顺序。
Main elements of the Gantt chart:
甘特图的主要元素:
tasks - are placed vertically;
任务 - 垂直放置;
time scale - is displayed horizontally (days, weeks, months);
时间刻度 - 水平显示(天、周、月);
task bars - horizontal lines showing the duration of each task.
任务栏 - 显示每个任务持续时间的水平线。
Visualization on the Chart changes based on the compliance of actual values with planned ones.
图表上的可视化会根据实际值与计划值的一致性而变化。
The example below shows a visualization of the construction of residential complexes.
下面的示例显示了住宅区建设的可视化 。