Table
登录后可下载

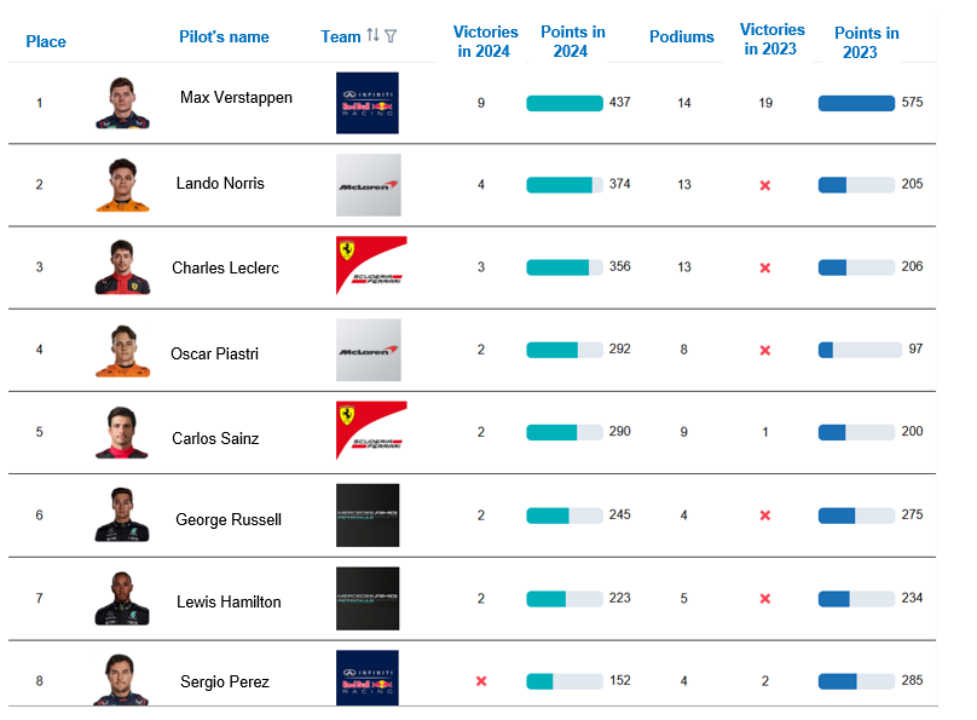
The Table has significant additional capabilities compared to similar charts in BI systems. Images can be placed in rows and columns.
与 BI 系统中的类似图表相比,该表具有重要的附加功能。图像可以放置在行和列中。
Also, each column can display data in the ProgressBar format (percentage of fill from a given value or maximum by column), rating (different number of stars instead of value), checkbox and calculated value.
此外 ,每列可以以 ProgressBar 格式显示数据( 给定值的填充百分比或列的最大值)、评级(不同数量的星星而不是值)、复选框和计算值。
The image can be displayed in the cell based on the conditions.
图像可以根据条件显示在单元格中。
The Chart provides the ability to filter, sort, select the displayed columns.
图表提供了过滤、排序和选择显示列的功能。
The Chart can visualize data on any activity of the organization.
图表可以可视化组织任何活动的数据。
The example below shows a visualization of the Formula 1 Grand Prix races.
下面的示例显示了一级方程式大奖赛比赛的可视化效果。